Free conversion audit
Get a tailored action plan based on your current funnel.
Why A/B Testing Matters More Than Another Redesign
A/B testing is one of the fastest ways to improve revenue without increasing traffic. If your site already gets qualified visitors, even a small lift in conversion rate can produce a meaningful gain in leads, sales, and return on ad spend.
That is why smart growth teams do not jump straight into a full redesign every time performance slips. They test one high-impact change at a time, measure what actually moved, and scale only the winners.
This guide breaks down how A/B testing works, what to test first, how long to run experiments, and the mistakes that create false winners. If you want cleaner decisions and better results from your traffic, this is the framework to follow.
What Is A/B Testing?
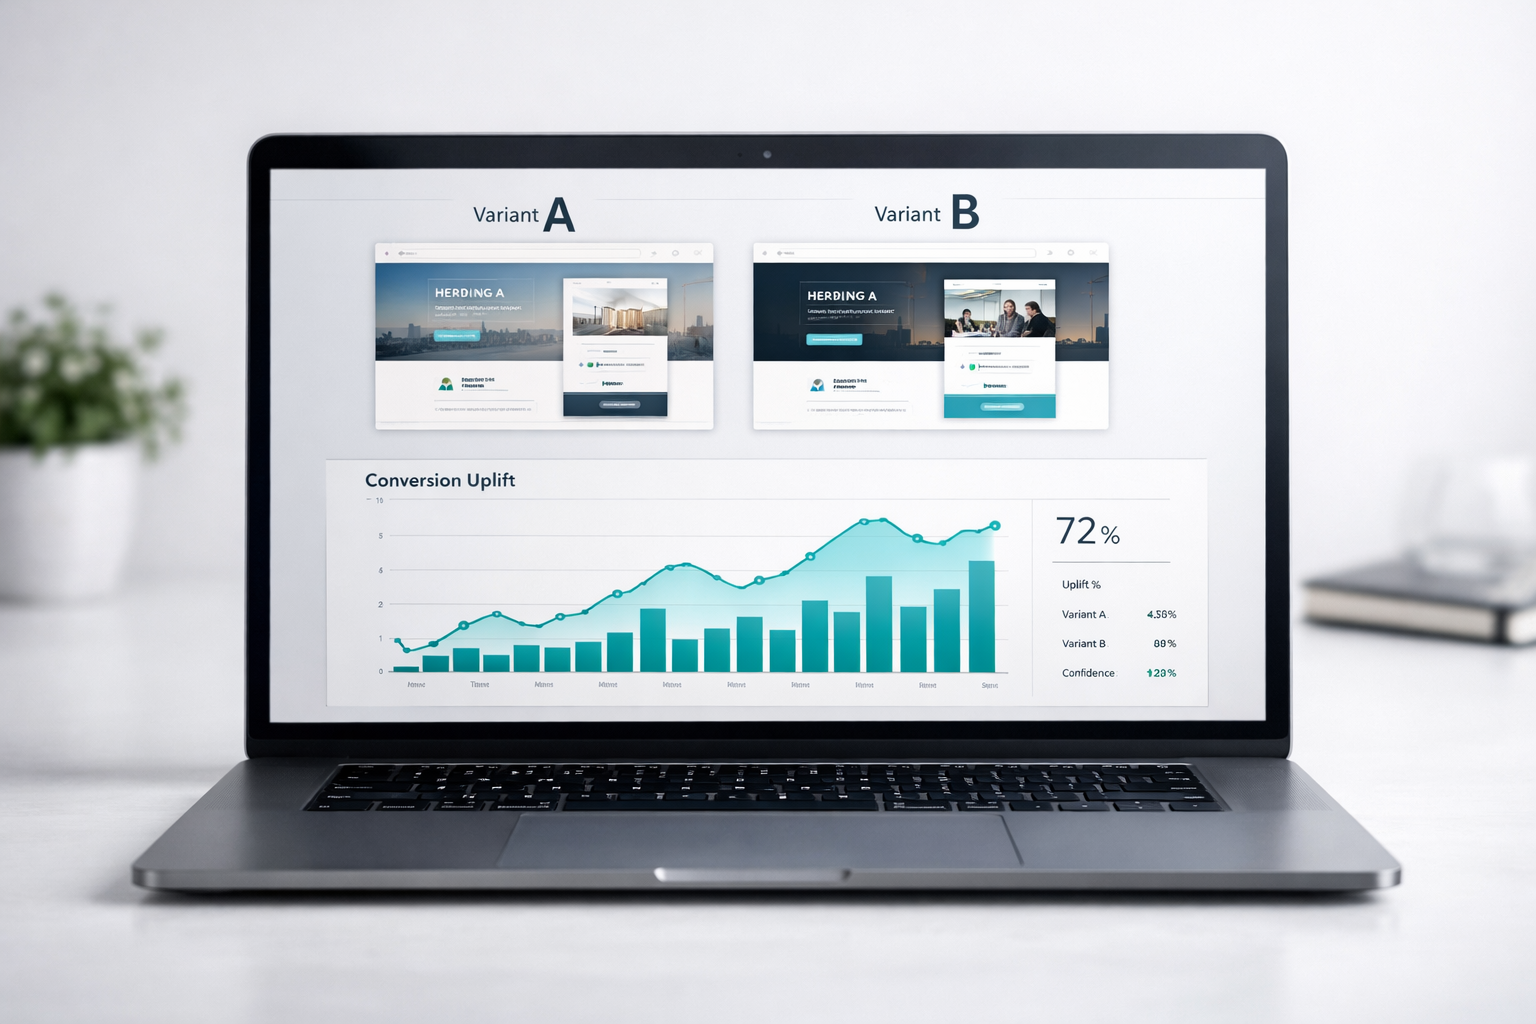
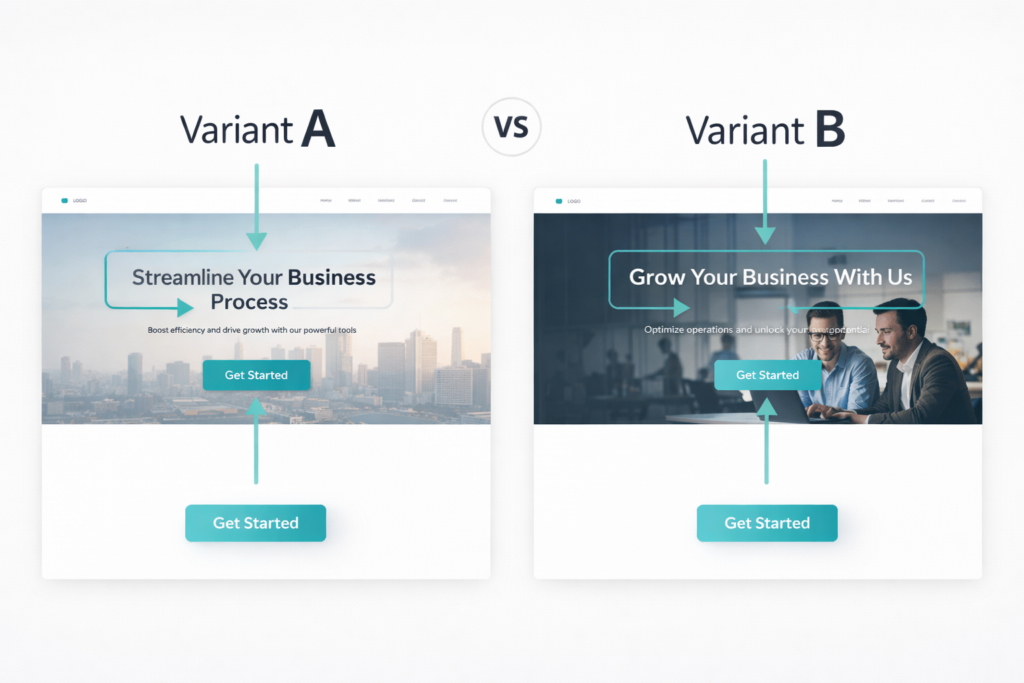
A/B testing is a controlled experiment where you compare two versions of a page, element, or user flow to see which version produces a better outcome. Version A is the control. Version B includes one deliberate change, such as a new headline, CTA, form layout, or product image.
The goal is simple: send similar users to both versions, track one primary conversion event, and measure whether the variation outperforms the original. Instead of relying on internal opinions, stakeholder preferences, or trend-driven redesigns, you are replacing opinion with evidence.
That evidence matters because conversion improvements compound. If your landing page converts at 2.1% and a better variant pushes it to 2.8%, that is a 33% lift from the same traffic. On 20,000 monthly visits, that difference can mean dozens or hundreds of additional conversions every month.
A/B Testing vs. Split Testing vs. Multivariate Testing
People often use these terms interchangeably, but they are not exactly the same.
- A/B testing usually means changing one element or one version of a page against a control.
- Split testing often refers to testing two separate URLs against each other.
- Multivariate testing tests multiple element combinations at once, which requires much more traffic to reach reliable conclusions.
For most service businesses, SaaS sites, and ecommerce stores under heavy enterprise scale, plain A/B testing website experiments are the right place to start. They are simpler to implement, easier to interpret, and less likely to produce muddy results from too many variables changing at once.
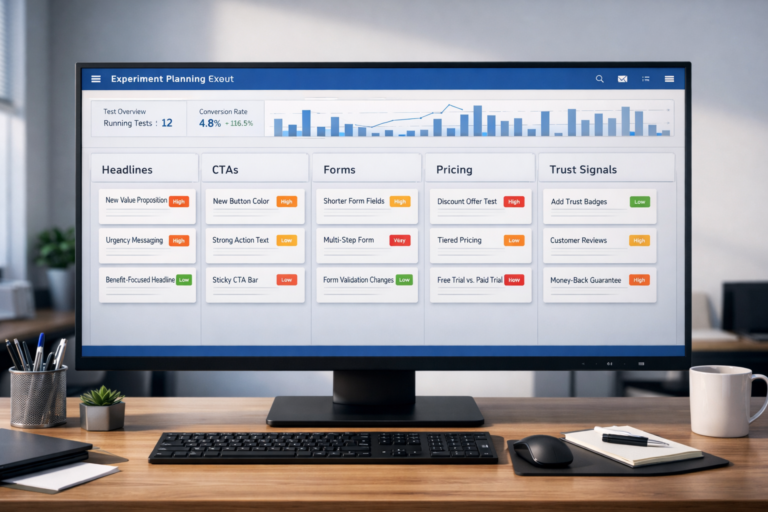
What Should You A/B Test First?
The best experiments are not random. You should start with the parts of your funnel that have the highest impact on revenue and the clearest friction signals in analytics, heatmaps, and session recordings.
In most cases, the first wave of A/B testing conversion rate optimization should focus on:
- Headline and value proposition — Does the page immediately explain what you do, who it is for, and why it matters?
- CTA copy — Does “Get My Free Audit” outperform “Contact Us”?
- CTA placement — Does moving the button above the fold increase clicks?
- Form length — Does reducing fields lift form completion rate?
- Trust signals — Do reviews, guarantees, or client logos near the CTA improve conversion?
- Pricing presentation — Does reframing pricing around ROI reduce drop-off?
- Hero imagery — Does a product-focused image outperform a decorative stock photo?
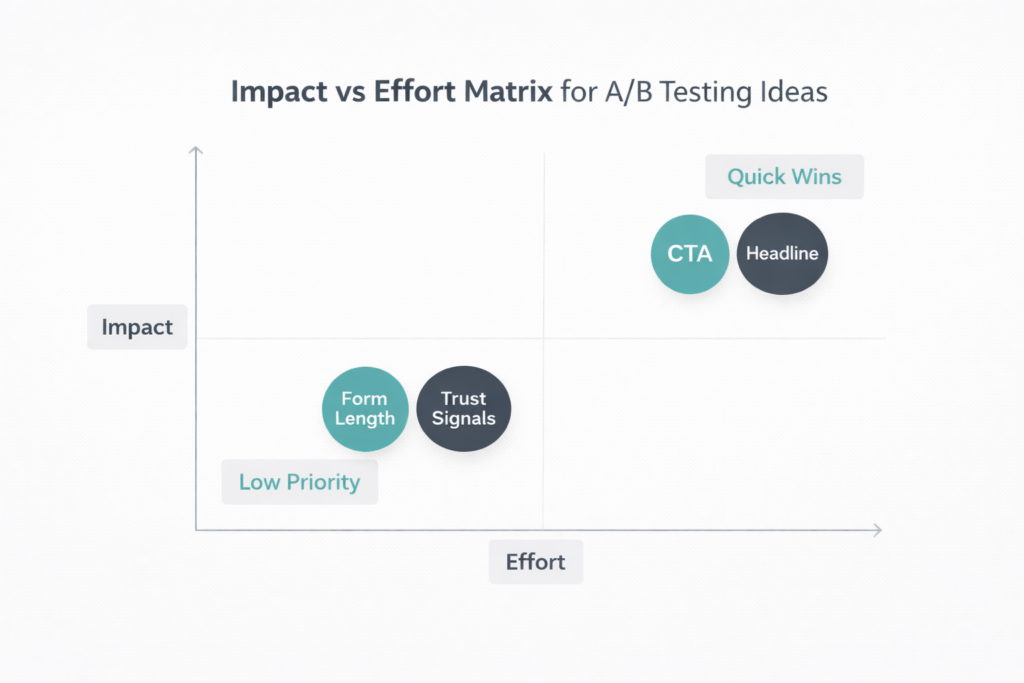
The shortcut is this: test what is closest to the decision point. A headline, CTA, pricing table, or form will usually outperform changes to secondary design details like icon style, border radius, or background textures.
How to Run A/B Testing Without Wasting Traffic
If you want to know how to run A/B testing correctly, follow a structured workflow instead of jumping straight into a tool.
- Find the leak. Use GA4, Microsoft Clarity, or your funnel analytics to locate the page with the highest drop-off.
- Define one hypothesis. Example: “If we rewrite the headline to clarify the offer, more visitors will click the primary CTA.”
- Choose one primary metric. This might be form submissions, purchases, demo bookings, or add-to-cart rate.
- Change one meaningful variable. Do not change the headline, CTA, image, and form all at once.
- Run the test long enough. Wait for a reliable sample size and normal traffic cycles.
- Review secondary metrics. A lift in clicks means little if downstream conversion quality falls.
- Ship the winner and document the learning. Every test should improve your next hypothesis.
This process matters because the cost of a bad experiment is not just a neutral result. If you send thousands of users to a weak variant or declare a winner too early, you can damage revenue and learn the wrong lesson.
Landing Page A/B Testing Ideas That Usually Produce Lift
Landing page A/B testing works best when the page has one clear job and one clear audience. That is why paid traffic pages are often the best candidates for experimentation. You control the source, the offer, and the conversion goal.
Some of the highest-probability landing page tests include:
- Benefit-led headline versus feature-led headline
- Single CTA versus multiple CTA options
- Short form versus multi-step form
- Customer result testimonial versus generic testimonial
- Static image versus product UI screenshot
- Trust badges near the form versus trust badges lower on the page
- CTA button with first-person copy versus neutral copy
For example, if a landing page currently says “Book a Consultation,” a better variant might say “Get My Free Growth Audit.” That is not just a wording tweak. It shifts the perceived value of the action and reduces uncertainty around what the visitor receives.
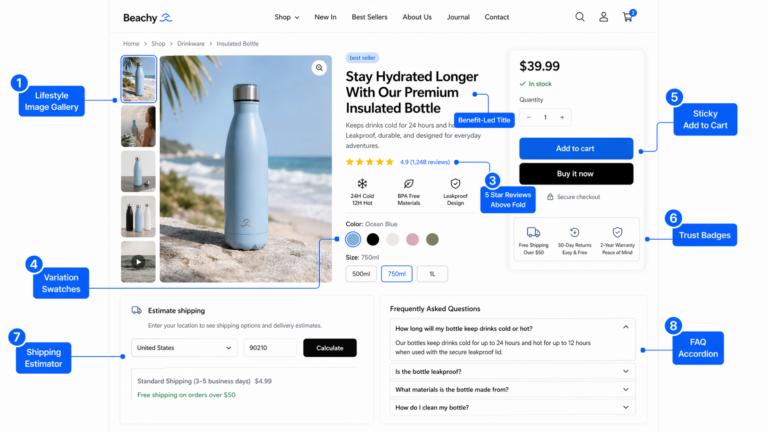
A/B Testing Example: A Pricing Page With Better CTA Framing
Here is a simple but realistic A/B testing example. Imagine a B2B services page with 12,000 monthly sessions and a current lead rate of 1.9%. The page headline is generic, the CTA says “Submit,” and the pricing section appears before any proof or outcomes.
The test hypothesis: if the page leads with a clearer promise, moves trust signals above pricing, and changes the CTA from “Submit” to “Get My Free Audit,” lead rate will increase.
In the variation, the headline becomes outcome-driven, three client logos and one testimonial appear beside the CTA, and the button copy becomes specific. If conversion rises from 1.9% to 2.6%, that is a lift from 228 leads to 312 leads per month from the same traffic. That is why experimentation beats guesswork.
This is also where conversion rate optimization becomes practical. You are not redesigning the whole site. You are improving the economics of the traffic you already paid for.
How Long Should an A/B Test Run?
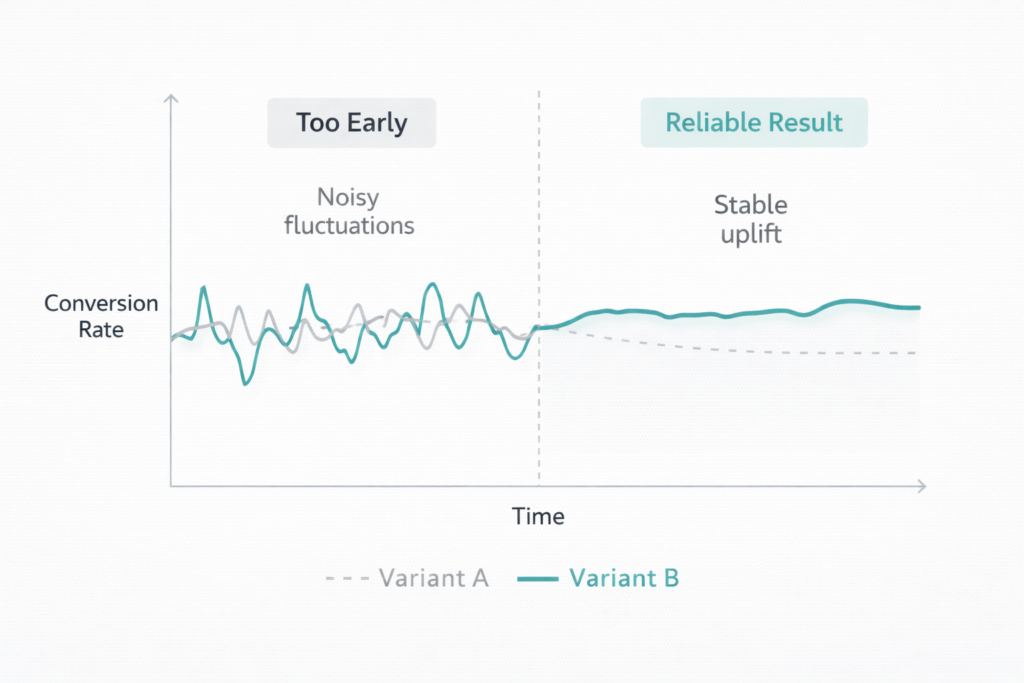
One of the biggest problems in website experimentation is stopping tests too early. Early results are noisy. A variation can appear to win on day three, then flatten completely once weekday traffic, weekend traffic, paid campaigns, and repeat visitors balance out.
As a general rule, let the test run through at least one full business cycle and wait until your sample is large enough to support a reliable decision. For many small and mid-size sites, that means 2 to 4 weeks, not 48 hours.
The exact timeline depends on traffic volume and baseline conversion rate. A page getting 100 conversions a day can reach clarity much faster than a page getting 8 conversions a week. The lower your traffic, the more important it is to test large, meaningful changes rather than tiny cosmetic ones.
If your site does not have enough volume to support traditional split testing, use a research-first workflow instead: heatmaps, user recordings, form analytics, and qualitative interviews. Then test only the highest-confidence hypotheses.
Which Metrics Matter in A/B Testing?
Your primary metric should always map to business value. More clicks are not enough if they do not lead to more qualified leads, revenue, or downstream actions.
For most businesses, the right hierarchy looks like this:
- Primary metric: purchases, booked calls, demo requests, completed forms, or checkout completions
- Secondary metrics: CTA clicks, add-to-cart rate, scroll depth, or engagement
- Guardrail metrics: bounce rate, refund rate, lead quality, average order value, or revenue per visitor
Here is why that matters. A more aggressive CTA might increase form submissions by 20%, but if lead quality falls and your sales team closes fewer deals, the test did not actually win. Good split testing looks beyond the first click.
Common A/B Testing Mistakes That Create False Winners
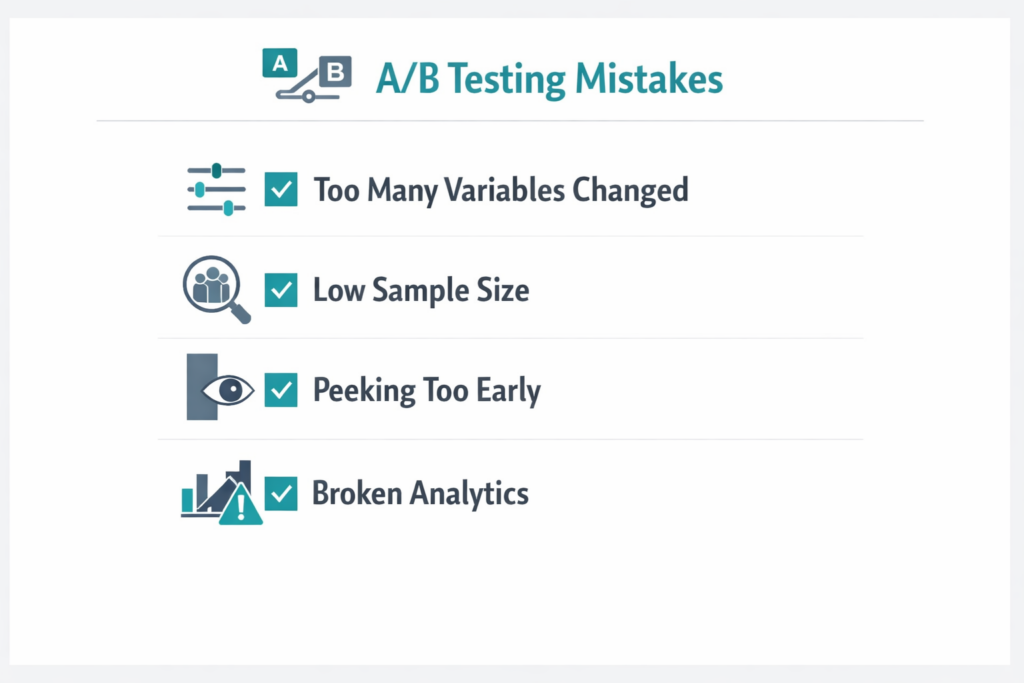
Most failed tests do not fail because experimentation does not work. They fail because the setup was weak from the start.
- Testing too many changes at once — You cannot tell which variable caused the lift.
- Calling the winner too early — Early noise gets mistaken for signal.
- Using weak traffic — Low-intent visitors produce weak learnings.
- Tracking the wrong event — Button clicks without downstream value can mislead you.
- Ignoring mobile behavior — A desktop win can become a mobile loss.
- Testing low-impact details first — Tiny cosmetic changes rarely move revenue.
There is another major mistake: testing without a research foundation. If you are not using recordings, heatmaps, search query data, or funnel analytics first, your hypotheses will be weaker and your roadmap slower.
When A/B Testing Does Not Work Well
A/B testing is powerful, but it is not universal. It works best when you have enough traffic, a clean measurement setup, and a focused page with one main conversion objective.
It works less well when:
- Your pages get very low traffic
- Your analytics are not configured correctly
- You change the offer mid-test
- Your traffic mix shifts dramatically during the experiment
- Your funnel depends on long offline sales cycles without proper attribution
In those cases, the smarter move is often to fix measurement first, improve page fundamentals, and tighten traffic quality from paid ads or SEO before you launch more experiments.
The Best A/B Testing Tools for Most Teams
You do not need an enterprise experimentation stack to start. Most teams can build a solid workflow with a small set of tools.
- Google Analytics 4 for funnel tracking and conversion events
- Microsoft Clarity for free heatmaps and session recordings
- VWO or Optimizely for experiment delivery
- Google PageSpeed Insights for speed diagnostics before testing
- Baymard Institute research for checkout and UX benchmarks
If your team also needs landing page fixes, performance improvements, or implementation support, pair experimentation with web development so the winning variants actually ship cleanly and load fast.
How Site OptimizR Approaches A/B Testing
At Site OptimizR, we treat A/B testing as part of a larger growth system. The experiment itself is not the strategy. The strategy is identifying which bottleneck is costing you the most money, building a high-confidence hypothesis, and testing changes that can materially improve revenue.
That means we start with research, not random ideas. We look at traffic quality, funnel drop-off, mobile UX, speed, CTA clarity, offer positioning, and trust signals before recommending an experiment roadmap.
The result is fewer vanity tests and more revenue-focused decisions. That is the difference between “we changed a button color” and “we improved the economics of the page.”
Get a Free CRO Audit Before You Launch Another Test
If your current pages are underperforming, more traffic is not the first answer. Better decisions are. A focused free CRO audit will show you where users drop off, which pages deserve testing first, and what hypotheses are worth running.
Site OptimizR helps businesses build cleaner experimentation roadmaps, improve landing page performance, and fix the friction points that drag down conversions. If you want to stop guessing and start learning what actually moves revenue, the next step is simple.
Get your free CRO audit and we will show you the highest-impact A/B testing opportunities on your site.