Free conversion audit
Get a tailored action plan based on your current funnel.
You’re Getting Traffic. So Why Is Your Conversion Rate So Low?
The average ecommerce website converts between 1% and 3% of its visitors. If you’re sitting below that range — or watching traffic climb while revenue stays flat — you don’t have a traffic problem. You have a conversion problem.
A low conversion rate means most of the people you’re paying to attract (through ads, SEO, or social) are leaving without buying, filling out a form, or taking any action at all. At scale, that’s not an inconvenience. It’s thousands of dollars walking out the door every week.
This post breaks down the 9 most common reasons your website isn’t converting — and gives you the exact fixes to turn it around. These aren’t vague recommendations. These are the same diagnostics we run on every conversion rate optimization engagement at Site OptimizR.
What Is a Good Conversion Rate? (Setting the Benchmark)
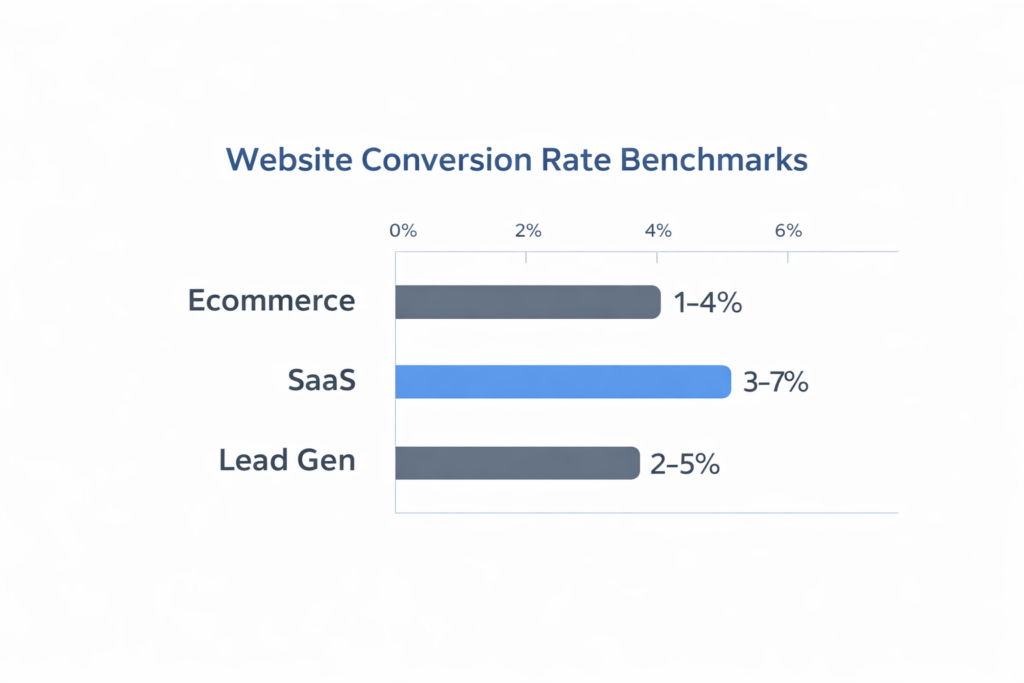
Before you can fix a low conversion rate, you need to know what you’re measuring against. Here’s a quick benchmark by site type:
- Ecommerce: 1%–4% (top 10% of stores exceed 5%)
- Lead generation: 2%–5%
- SaaS free trial or demo: 3%–7%
- Landing pages (paid traffic): 4%–8%
If your site is generating traffic but converting below 1%, something is fundamentally broken. If you’re between 1% and 2%, you likely have several fixable friction points. 2% to 4% is the baseline you should be aiming for — anything above that is where real revenue growth starts compounding.
9 Reasons Your Conversion Rate Is Low — And How to Fix Each One
1. Your Page Load Time Is Over 3 Seconds
Speed is the first conversion killer. 53% of mobile users abandon a page that takes longer than 3 seconds to load, and Google’s own research shows a direct correlation between load time and bounce rate. Every additional second of delay drops conversions by an estimated 7%.
Run your site through Google PageSpeed Insights. Your Largest Contentful Paint (LCP) should be under 2.5 seconds. If it isn’t, the top culprits are oversized images, render-blocking scripts, and unoptimized hosting. Fix speed first — everything else is secondary if people aren’t staying long enough to read your offer.
Quick win: Convert all images to WebP, add loading="lazy" to below-the-fold images, and defer non-critical JavaScript.
2. Your Hero Section Doesn’t Pass the 5-Second Test
A visitor lands on your page and has one question: Is this for me? You have roughly 5 seconds to answer it. If your headline is vague, your value proposition is buried, or your CTA isn’t immediately visible, they’re gone.
Your hero needs three things above the fold: a clear headline stating what you do and who it’s for, a one-sentence benefit statement, and a single call to action. Remove background videos, carousels, and animated intros that delay rendering and distract from the action you want taken.
3. Your Call to Action Is Weak, Generic, or Buried
“Submit,” “Learn More,” and “Click Here” are not calls to action. They’re navigation labels. Specific CTAs consistently outperform generic ones by 90%+ in A/B tests. “Get My Free Audit” beats “Contact Us.” “Start My 14-Day Trial” beats “Sign Up.” “Show Me Pricing” beats “View Plans.”
Your CTA button should appear above the fold, repeat after every major section, use a contrasting color against your background, and be at least 44×44px on mobile. If a visitor has to scroll to find a way to take action, your conversion rate will reflect that.
4. You’re Driving the Wrong Traffic
A low conversion rate isn’t always a page problem — sometimes it’s an audience problem. If your paid ads are targeting broad keywords, or your SEO content is attracting informational readers who were never going to buy, no amount of on-page optimization will help.
In Google Analytics 4, segment your traffic by source. Compare conversion rates by channel, campaign, and keyword. You may find one traffic source converts at 5% while another converts at 0.2%. Shifting budget toward the highest-converting sources often produces faster results than redesigning pages.
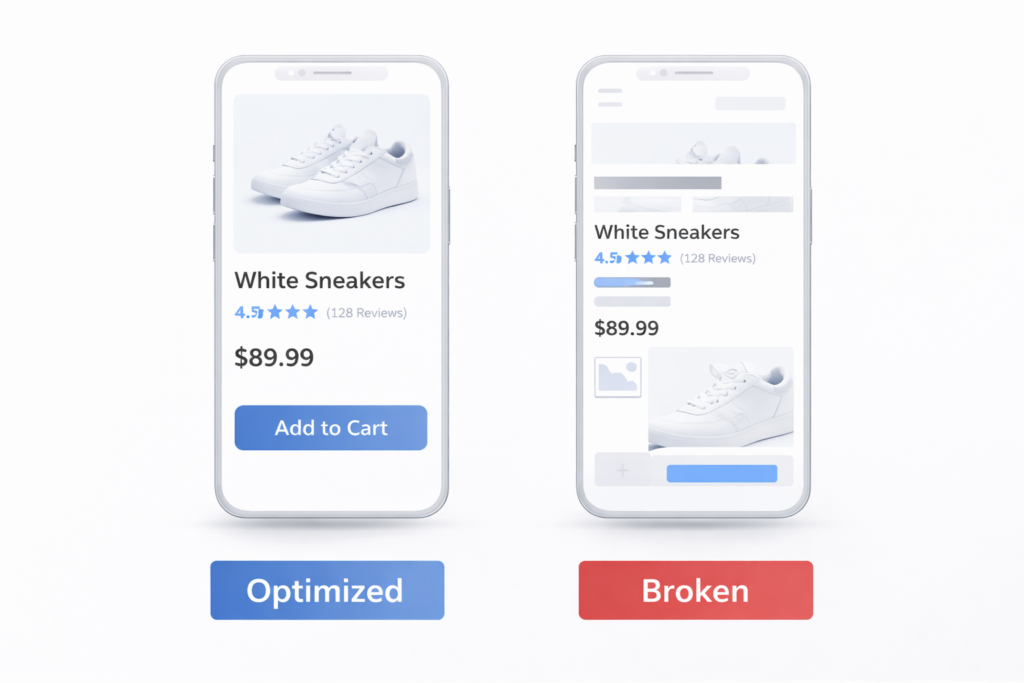
5. Your Mobile Experience Is Broken
Mobile devices account for over 60% of all web traffic, but mobile conversion rates average less than half of desktop rates. That gap is almost entirely caused by poor mobile UX — not by differences in buyer intent.
The most common mobile failure points: CTA buttons below the fold or too small to tap, pop-ups that block content, form fields that don’t trigger the right keyboard type (inputmode="tel", inputmode="email"), and checkout flows with too many steps. Walk through your full conversion path on a real device — not a browser emulator — and time every step.
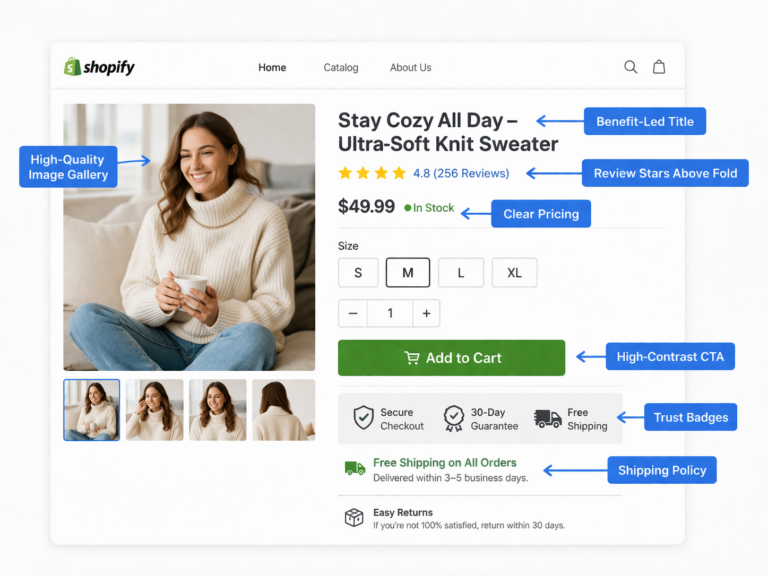
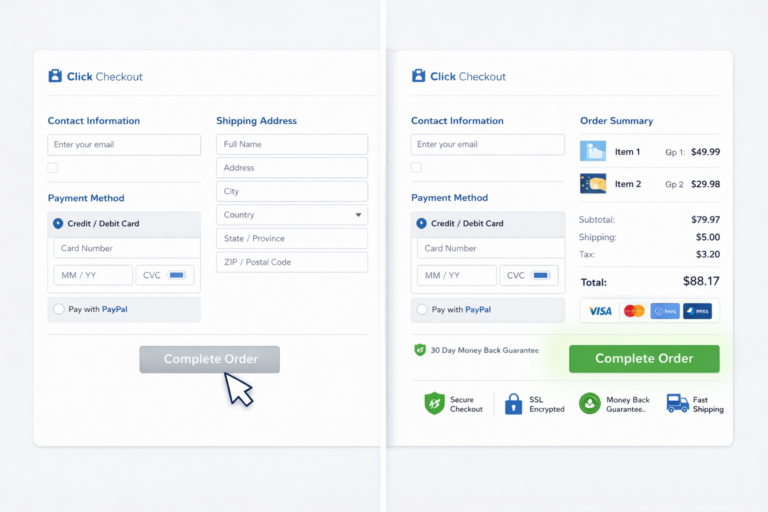
6. Your Trust Signals Are Missing or in the Wrong Place
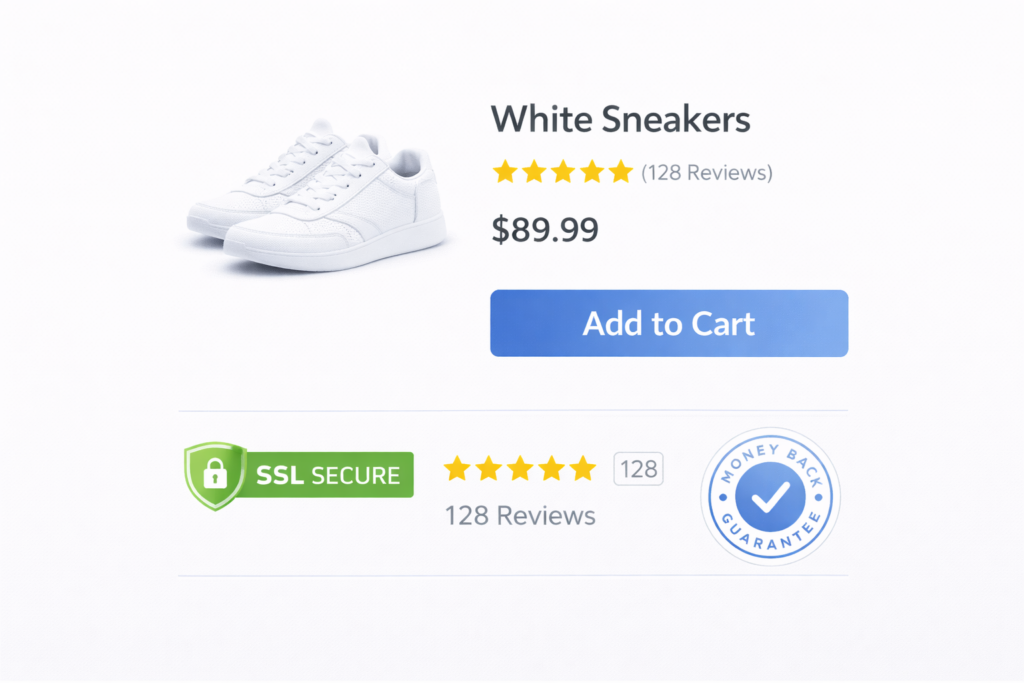
Visitors who don’t trust you won’t buy from you — no matter how good your offer is. Adding trust badges near checkout reduces cart abandonment by up to 19%. Yet most sites bury social proof in a footer section nobody reads, or display it nowhere near the point of decision.
Trust signals that actually convert: star ratings and review counts directly on product or service pages, real client logos, specific measurable outcomes (not vague testimonials), security badges near payment fields, and a visible refund or satisfaction guarantee. The placement matters as much as the signal itself — put trust elements immediately adjacent to your CTA.
7. Your Form Has Too Many Fields
Every additional form field reduces completion rates. Cutting a form from 11 fields to 4 fields increases submissions by over 120% in documented case studies. Yet most lead generation forms ask for information the business doesn’t need at this stage — company size, job title, phone number, and so on.
Start with the minimum viable form: name, email, and one qualifying question. Collect additional information after the lead has engaged. If your form is on a longer page, make sure it’s visible without scrolling on mobile, and test browser autofill behavior across Chrome, Safari, and Firefox.
8. There’s No Urgency or Social Proof at the Decision Point
People delay decisions when there’s no reason to act now. If your pricing page or product page has no urgency mechanism, many visitors who are genuinely interested will save the tab and never return.
Effective urgency is specific and honest: limited-time offers with real end dates, inventory scarcity (“only 3 slots remaining this month”), cohort-based deadlines (“enrollment closes Friday”), or time-sensitive bonuses. Social proof at the decision point — “47 businesses signed up this week”, “Trusted by 1,200+ stores” — reduces hesitation at the exact moment it matters most.
9. Your Price Isn’t Contextualized
Sticker shock kills conversions when price is shown without context. A $497/month service feels expensive in isolation. It feels like an obvious decision when shown next to the revenue it generates, the cost of doing it in-house, or a daily breakdown of what’s included.
Price anchoring, value stacking, and ROI framing belong on your pricing page. Lead with outcomes, not features. Show the cost of inaction, not just the cost of the service. If you offer a money-back guarantee, display it on the pricing page — not buried in the FAQ.
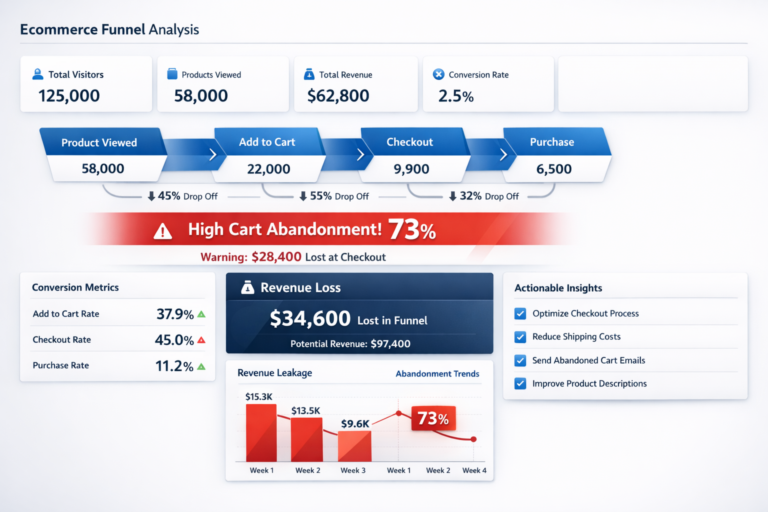
How to Diagnose a Low Conversion Rate (Free Tools)
Before you can fix the right problem, you need data. These free tools show you exactly where your funnel is breaking:
- Google Analytics 4 — Set up conversion events, analyze funnel steps, and segment by traffic source. Look for pages with high exit rates within your conversion path.
- Microsoft Clarity — Free session recordings and heatmaps. Clarity automatically flags “rage clicks,” “dead clicks,” and excessive scroll patterns on your key pages.
- Google PageSpeed Insights — LCP, INP, and CLS scores per page. Shows exactly which resources are delaying load on mobile and desktop.
- Google Search Console — Identify queries driving clicks with high bounce rates. Mismatched search intent shows up immediately in your engagement data.
- A/B testing (VWO or Convert) — Once you form a hypothesis, test it against the control before committing to a site-wide change.
The diagnostic sequence: identify the page with the highest drop-off in your funnel → run a heatmap and session recording → form a specific hypothesis → A/B test the fix → validate at statistical significance before scaling.

Real Example: 1.1% to 3.8% Conversion Rate in 11 Weeks
A B2B SaaS client came to Site OptimizR with a 1.1% trial signup rate on their pricing page. Traffic was healthy — 14,000 monthly sessions from organic and paid — but the page wasn’t converting. A CRO audit surfaced four root causes:
- The hero headline led with product features, not the outcome the buyer wanted
- The primary CTA said “Start Free Trial” but the most prominent button linked to a contact form
- No trust signals appeared near the pricing table
- Mobile LCP was 5.8 seconds
Fixes applied: outcome-led headline rewrite, CTA color and copy update, addition of 23 client logos and a “No credit card required” trust line near the CTA, and a page speed optimization bringing mobile LCP to 1.9 seconds.
Result: conversion rate climbed from 1.1% to 3.8% in 11 weeks. On 14,000 monthly sessions, that’s the difference between 154 trials and 532 trials per month — from the exact same traffic.
Low Conversion Rate Audit Checklist
Before investing in more traffic or a full redesign, run through this checklist:
- LCP under 2.5 seconds on mobile
- Hero headline states what you do and who it’s for in one line
- Primary CTA is visible above the fold on all devices
- CTA copy is specific and outcome-oriented (not “Submit” or “Learn More”)
- Trust signals appear directly adjacent to the CTA
- Top-of-funnel forms use 4 fields or fewer
- Mobile tap targets are at least 44×44px
- No interstitials block the conversion path on mobile
- At least one urgency element on pricing and product pages
- Price is contextualized with ROI framing or a comparison
- GA4 conversion events are tracking correctly (not just pageviews)
- Highest-exit pages in your funnel have active session recordings
Get a Free CRO Audit — Find Out Exactly What’s Costing You Conversions
A low conversion rate isn’t a mystery — it’s a set of fixable, diagnosable problems. But identifying them correctly, prioritizing the highest-impact changes, and implementing without breaking other parts of your funnel takes the right framework and experience.
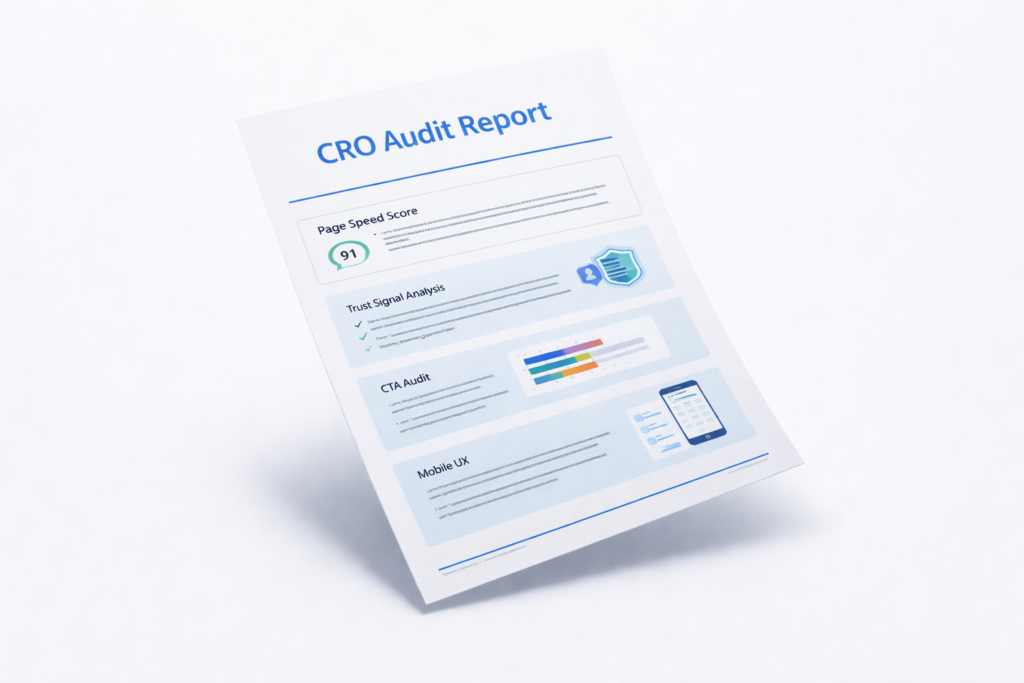
At Site OptimizR, we run a full free CRO audit covering your top landing pages, conversion funnel, mobile experience, page speed, and trust signal placement. You’ll receive a prioritized action list — not a generic PDF — with exactly where your conversions are leaking and what to fix first.
Most clients see measurable lift within the first 30 days. Book your free audit today and find out what your current traffic is actually worth.