Free conversion audit
Get a tailored action plan based on your current funnel.
Your Shopify Conversion Rate Is Not Just a Number — It Is a Verdict
Every Shopify store owner checks their conversion rate. Most look at the number, feel vaguely disappointed, and move on. But that number is telling you something specific — and without context, you have no idea whether your store is underperforming, average, or actually ahead of the curve.
Shopify conversion rate benchmarks give you that context. They tell you what stores in your industry, at your traffic level, on the same devices are actually converting at — so you can stop guessing and start making decisions based on real data.
This guide breaks down the latest 2026 benchmarks by industry, traffic source, device, and store size. More importantly, it tells you exactly what to fix at every performance tier. If your conversion rate is below where it should be, you will know why by the end of this page.
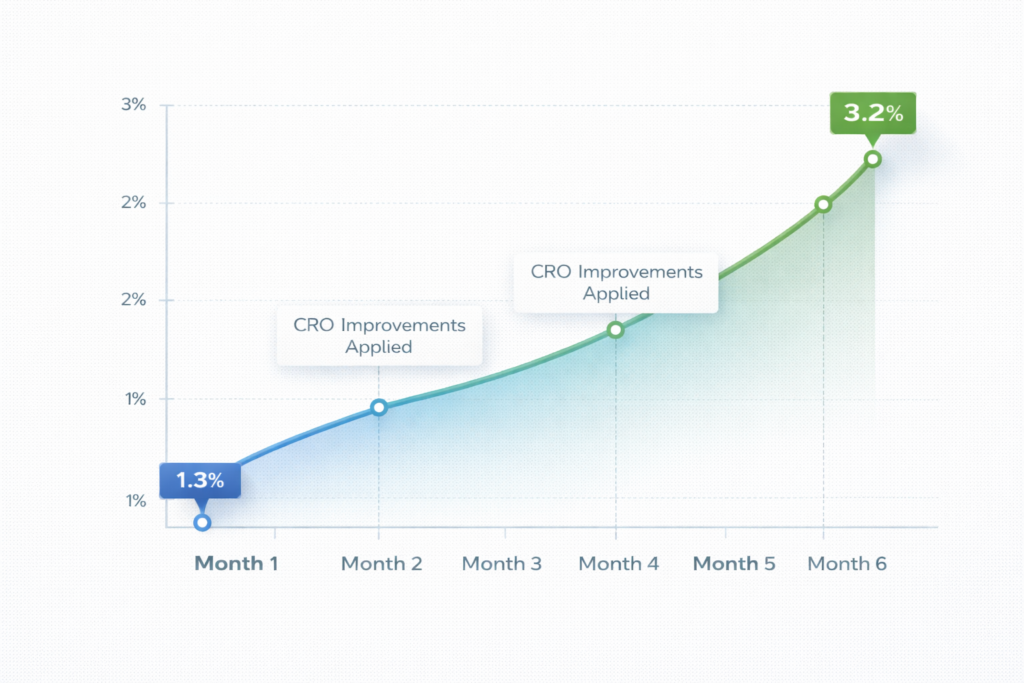
The Numbers: Average Shopify Conversion Rates in 2026
Before we get into segments, here is the broad picture across all Shopify stores globally:
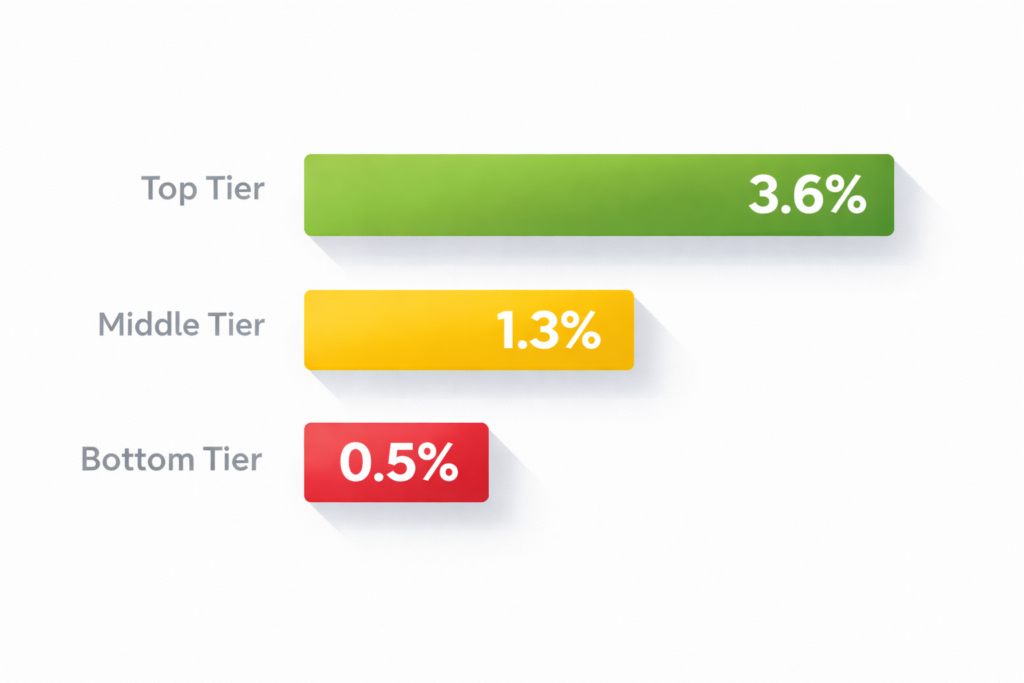
- Bottom 20% of stores: Below 0.5% conversion rate
- Average Shopify store: 1.3% conversion rate
- Top 20% of stores: 3.2% or higher
- Top 10% of stores: 4.7% or higher
That 1.3% average is the number most people reference, and it is directionally accurate based on aggregated data from Littledata, Shopify’s own reports, and third-party analytics platforms tracking tens of thousands of stores. But averages are misleading. A store selling $15 phone cases to impulse-buying social traffic and a store selling $2,000 furniture to organic search visitors are in completely different universes — yet both get lumped into the same “average.”
The segments below give you a much more useful picture.
Conversion Rates by Industry
Industry is the single biggest variable affecting your benchmark. A “good” conversion rate in fashion would be disastrous in food and beverage. Here is how the major verticals break down:
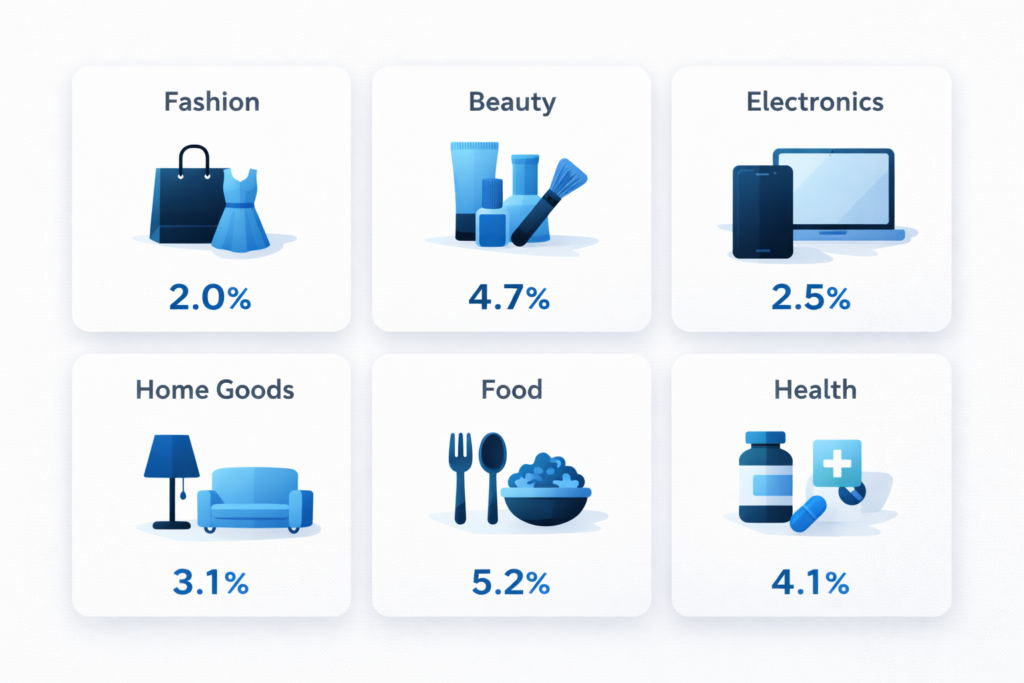
Fashion and Apparel: 1.4% – 2.0%
Fashion is the largest Shopify vertical and one of the most competitive. The wide range reflects the difference between stores with strong brand identity and stores competing purely on price. Top fashion stores differentiate with lifestyle photography, size guides that reduce returns, and social proof from user-generated content. If you are below 1.4%, your Shopify product pages are likely the first place to look.
Health and Beauty: 1.8% – 2.8%
Health and beauty benefits from high repeat purchase rates and strong emotional buying triggers. Subscription models, ingredient transparency, and before/after social proof push the best stores past 2.5%. The category also benefits from shorter consideration cycles — most purchases are under $60, reducing the decision friction that kills conversion in higher-AOV verticals.
Home and Garden: 1.0% – 1.8%
Higher average order values and longer consideration windows bring this category’s benchmarks down relative to impulse-friendly verticals. Stores that invest in room visualization, detailed product specs, and financing options for bigger purchases consistently land in the upper range. Poor checkout experiences are especially costly here — abandoning a $400 cart hurts more than abandoning a $30 one.
Food and Beverage: 2.0% – 3.5%
The highest-converting Shopify vertical. Low price points, consumable products, and subscription/auto-replenishment models create near-frictionless purchase decisions. If your food or beverage store is below 2.0%, something fundamental is wrong — likely site speed, a complicated checkout, or missing trust signals.
Electronics and Technology: 0.8% – 1.5%
The longest research cycles and highest price sensitivity in ecommerce. Shoppers compare specs across multiple sites before buying. Stores that win here provide exhaustive comparison content, transparent pricing (no hidden fees at checkout), and generous return policies that de-risk the purchase. Below 0.8% typically signals a trust problem — either the brand is unknown or the store does not look credible enough for high-value transactions.
Jewelry and Accessories: 1.0% – 1.6%
Highly visual category where product photography makes or breaks conversion. Stores with lifestyle imagery, 360-degree views, and detailed material/sizing information outperform those with basic product-on-white shots. Gift-buying traffic spikes around holidays can temporarily inflate rates — so track your non-seasonal baseline separately.
Conversion Rates by Traffic Source
Where your visitors come from matters as much as how many you get. The same store can have a 4% conversion rate from email and a 0.3% rate from cold social — and both are normal. Here is how the major channels perform on Shopify:
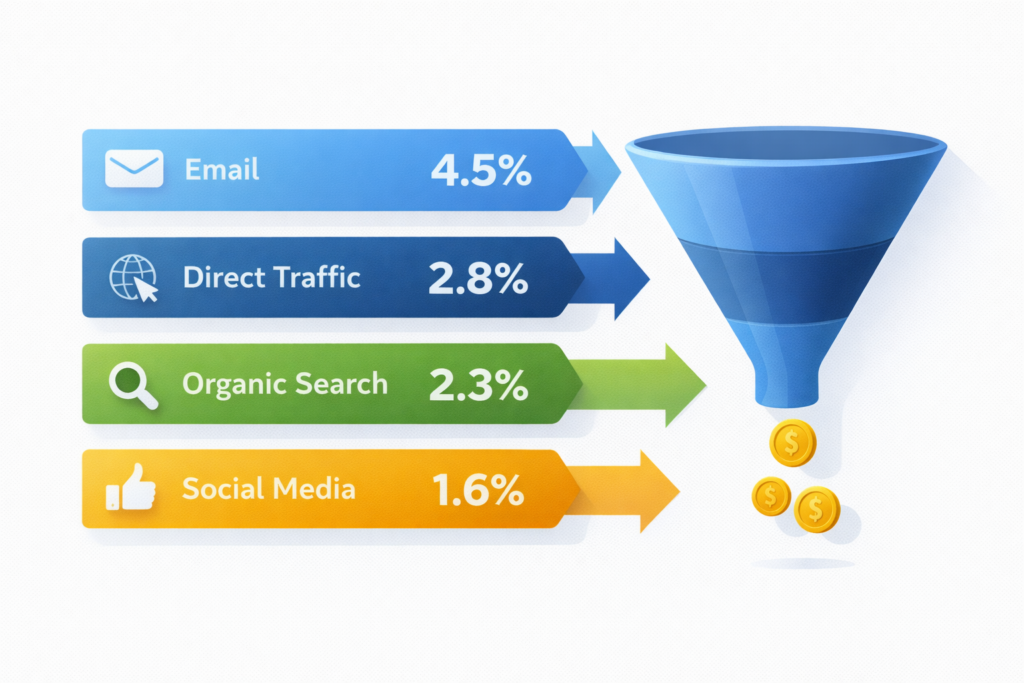
Email: 3.8% – 5.5%
The highest-converting channel by a wide margin. These visitors already know your brand, have opted in, and are responding to a specific offer or message. If your email traffic converts below 3.5%, your email content and landing page alignment is off — the message in the email is not matching what visitors see when they click through.
Direct Traffic: 2.5% – 3.5%
People who type your URL or use a bookmark are already high-intent. They have been to your store before or heard about you from a trusted source. Low direct traffic conversion usually means your homepage or returning-visitor experience is weak — they came back ready to buy and your site did not make it easy.
Organic Search: 1.5% – 2.5%
Search visitors are actively looking for what you sell — but they may be comparing options. Strong product pages, clear value propositions above the fold, and visible social proof are what separate a 1.5% organic rate from a 2.5% one. If you are getting good organic traffic but poor conversion, the gap is almost always on the landing page experience, not the SEO.
Paid Search (Google/Bing Ads): 1.2% – 2.2%
Similar to organic but with wider variance because ad targeting quality matters enormously. A well-targeted campaign sending high-intent shoppers to optimized landing pages can outperform organic. A broad campaign dumping cold traffic onto a generic collection page will underperform badly. The fix is always landing page alignment — make sure the page delivers exactly what the ad promised.
Social Media (Organic): 0.5% – 1.0%
The lowest-converting major channel. Social visitors are browsing, not buying. They saw something interesting in a feed and clicked — but they are not in purchase mode. Expecting social traffic to convert at search-level rates is a strategy error. Use social for top-of-funnel awareness and retargeting. Build conversion expectations around retargeted social visitors instead (which convert closer to 2–3%).
Paid Social (Facebook/Instagram/TikTok Ads): 0.8% – 1.8%
Better than organic social because targeting narrows the audience, but still interrupt-based traffic. The stores that convert well from paid social use purpose-built landing pages — not just their homepage or a collection page. They match the creative from the ad to the page experience, minimize distractions, and keep the path to purchase under 3 clicks.
Mobile vs Desktop: The Conversion Gap That Refuses to Close
Despite years of “mobile-first” design, the mobile-desktop conversion gap on Shopify remains significant:
- Desktop: 2.1% average conversion rate
- Tablet: 1.8% average conversion rate
- Mobile: 1.0% average conversion rate
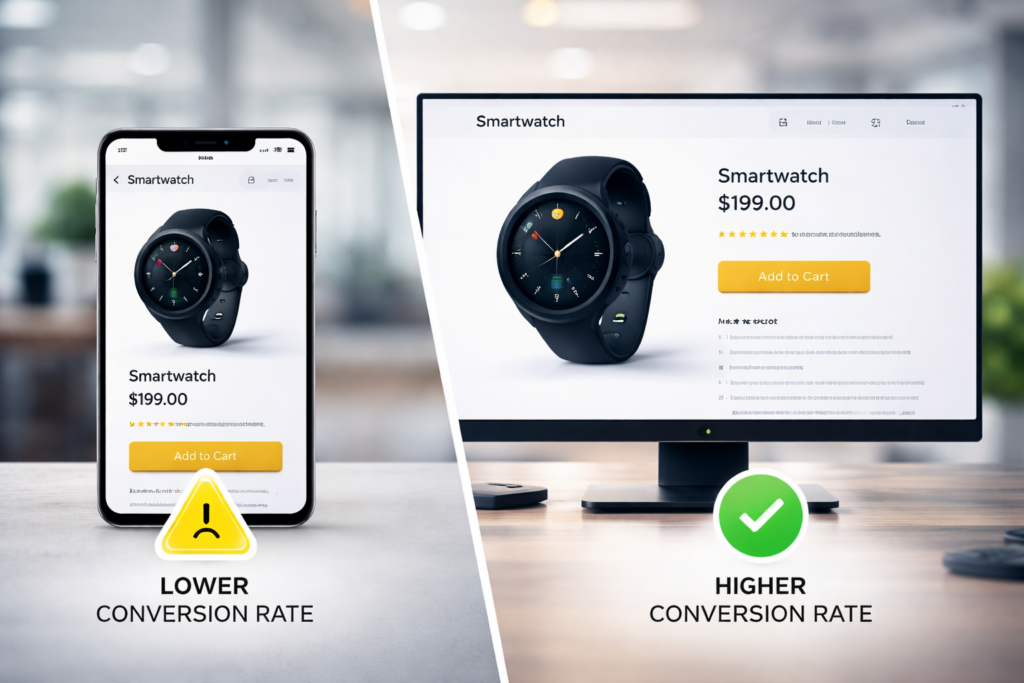
Mobile traffic now accounts for over 70% of all Shopify store visits — but it converts at less than half the desktop rate. This is not a design problem you can solve with a responsive theme. It is a friction problem: smaller screens make browsing easy but purchasing hard.
The stores that close this gap focus on three things:
- Speed: Mobile users are less patient. Every 100ms of additional load time costs roughly 1.1% in conversion. Shopify speed optimization is non-negotiable if your mobile traffic is high.
- Thumb-friendly checkout: Form fields that are too small, dropdowns that require precision tapping, and payment options that redirect to external sites all kill mobile conversion. Shop Pay, Apple Pay, and Google Pay can reduce mobile checkout friction by 40–60%.
- Simplified navigation: Mobile users scroll more and search less. If your product discovery requires three levels of nested menus, you are losing people before they see a single product.
Conversion Rates by Store Size and Traffic Volume
Store maturity and traffic volume affect benchmarks in ways that are not immediately obvious:
New Stores (Under 1,000 Monthly Visitors)
Conversion rates are unreliable at low traffic volumes. A store with 200 visitors and 4 orders shows a 2.0% rate — but that could easily be 0% or 4% next month due to pure statistical noise. Do not optimize for conversion rate at this stage. Focus on traffic acquisition and product-market fit. You need at least 1,000 monthly visitors before conversion metrics are meaningful.
Growing Stores (1,000 – 10,000 Monthly Visitors)
This is where benchmarks start to matter. Most stores in this bracket see 0.8% – 1.5%. The primary lever is conversion rate optimization on your highest-traffic pages — typically the homepage, one or two collection pages, and your top 5 product pages. Small improvements here compound because you have enough traffic for changes to produce measurable results. Use the A/B test calculator to determine how long tests need to run at your traffic level.
Established Stores (10,000 – 100,000 Monthly Visitors)
Stores at this level typically convert at 1.5% – 2.5%. The optimization approach shifts from fixing obvious problems to systematic A/B testing. At 50,000+ monthly visitors, you can run statistically significant tests on individual pages in 2–4 weeks. This is where CRO programs deliver the highest ROI — the traffic volume is large enough that even a 0.2% conversion lift translates to meaningful revenue. See what that looks like in dollars with the CRO ROI calculator.
High-Volume Stores (100,000+ Monthly Visitors)
Top-tier stores typically sustain 2.5% – 4.0%+ conversion rates. At this scale, most low-hanging fruit is already optimized. Gains come from micro-optimizations: button color tests, copy variations, checkout flow simplification, and personalization. A 0.1% lift at 500,000 monthly visitors can mean hundreds of thousands in additional annual revenue.
How to Know If Your Conversion Rate Is Actually a Problem
A below-average conversion rate does not automatically mean your store is broken. Context matters. Before you panic, check these factors:
1. Are You Comparing Against the Right Benchmark?
If you sell $800 standing desks and you are comparing your rate against a beauty brand selling $25 serums, your “low” rate might actually be strong. Use the industry and AOV benchmarks above — not the global Shopify average.
2. Is Your Traffic Quality the Problem?
A store getting 90% of its traffic from broad TikTok campaigns will have a naturally lower conversion rate than one getting traffic from branded Google searches. Low conversion from cold traffic is expected. Low conversion from email subscribers or branded search is a genuine red flag. Check your conversion rate by channel in Google Analytics before assuming it is a site-wide issue.
3. Has Your Rate Changed or Was It Always Like This?
A sudden drop is different from a consistently low baseline. Drops indicate something broke — a technical issue, a broken checkout flow, a price increase that backfired. A flat low rate suggests a structural problem with your value proposition, product pages, or targeting. The diagnostic approach is different for each scenario. If you are dealing with a sudden decline, start with the low conversion rate troubleshooting guide.
The 5 Highest-Impact Fixes by Conversion Tier
Where you fall in the benchmark spectrum determines which optimizations will move the needle the most:
If You Are Below 0.5% (Critical)
- Fix trust: Add SSL badge, clear return policy, real contact info, and customer reviews to every product page
- Fix speed: Audit with Google PageSpeed — if your LCP exceeds 4 seconds, nothing else matters until speed is fixed
- Fix navigation: Can a first-time visitor find and purchase a product in under 60 seconds? If not, simplify
- Fix pricing transparency: Hidden shipping fees at checkout are the number one conversion killer at this tier
- Fix mobile: Test the entire purchase flow on a phone — if anything is frustrating, it is costing you orders
If You Are at 0.5% – 1.3% (Below Average)
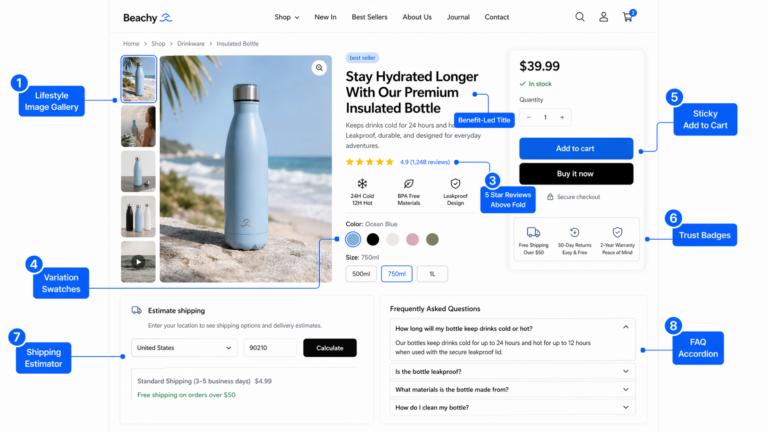
- Upgrade product pages: Better product page optimization — more images, benefit-led copy, urgency elements, social proof near the CTA
- Reduce cart abandonment: Implement cart recovery sequences (email + SMS) — this recovers 5–15% of abandoned carts on average
- Add accelerated checkout: Shop Pay, Apple Pay, and Google Pay reduce checkout steps by 60%
- Improve above-fold content: Your homepage and collection pages need to communicate value in under 3 seconds
- Install heatmaps: Hotjar or Microsoft Clarity will show you exactly where visitors drop off — stop guessing
If You Are at 1.3% – 2.5% (Average to Good)
- Start A/B testing: You have enough traffic to run statistically sound tests. Test headlines, CTAs, product page layouts, and pricing displays
- Optimize your checkout: At this tier, checkout optimization delivers the highest marginal returns — every friction point removed converts directly to revenue
- Segment your conversion data: Stop looking at one blended rate. Break it by device, by channel, by landing page. You will find specific pages or flows underperforming while others are strong
- Build landing pages for ads: If you run paid traffic, purpose-built landing pages outperform generic collection pages by 30–50%
- Increase email revenue share: Email converts at 3.8%+. If email is less than 25% of your total revenue, you are leaving money on the table
If You Are Above 2.5% (Strong)
- Focus on AOV: At high conversion rates, increasing average order value is often more profitable than squeezing out another 0.1% in conversion. Bundles, upsells, and free shipping thresholds are your levers
- Personalization: Segment returning visitors and serve personalized content — product recommendations, loyalty pricing, and dynamic landing pages based on past behavior
- Run multi-variate tests: With high traffic, you can test multiple variables simultaneously to find interaction effects that simple A/B tests miss
- Invest in retention: At this tier, new customer acquisition costs are your biggest drag. Shift spend toward loyalty, referral, and subscription programs
- Audit for diminishing returns: Some CRO efforts at high conversion rates actually hurt revenue by attracting lower-quality conversions (deep discounters, return-heavy customers). Track revenue per visitor, not just conversion rate
Three Metrics That Matter More Than Conversion Rate Alone
Conversion rate is the most commonly tracked metric, but it is not the whole picture. These three companion metrics prevent you from optimizing the wrong thing:
Revenue per Visitor (RPV)
RPV = Conversion Rate × Average Order Value. A store converting at 1.5% with a $120 AOV ($1.80 RPV) is healthier than one converting at 3.0% with a $40 AOV ($1.20 RPV). If your CRO efforts increase conversion rate but decrease AOV (because you are attracting discount seekers), your RPV might actually drop. Always track RPV alongside conversion rate.
Customer Acquisition Cost (CAC)
A 2% conversion rate is excellent — unless you are spending $80 in ad spend per customer to achieve it on a $50 AOV product. CAC in relation to customer lifetime value (LTV) determines whether your traffic strategy is sustainable, regardless of conversion rate.
Pages per Session / Session Duration
Low conversion paired with high engagement (many pages viewed, long sessions) suggests your traffic is interested but your conversion funnel has a specific leak — usually the checkout or the product page CTA. Low conversion paired with low engagement (bounce) means the traffic quality or the landing page experience is the problem. The fix is completely different depending on which pattern you see.
Frequently Asked Questions
What is a good Shopify conversion rate?
A “good” conversion rate depends on your industry, traffic source, and average order value. The average Shopify store converts at 1.3%. Stores in the top 20% convert at 3.2%+. Health and beauty stores can target 2.5%+, while electronics stores at 1.5% are performing well. Compare against your specific vertical, not the global average.
Why is my Shopify conversion rate so low?
The most common causes of low conversion on Shopify are slow page speed (LCP above 3 seconds), poor mobile experience, missing trust signals (reviews, return policy, secure checkout indicators), high shipping costs revealed late in checkout, and misaligned traffic (sending cold social visitors to product pages designed for search intent). Start with the low conversion rate diagnosis guide to identify your specific issue.
How do I calculate my Shopify conversion rate?
Conversion Rate = (Number of Orders ÷ Number of Sessions) × 100. You can find this directly in your Shopify Analytics dashboard under “Online Store Conversion Rate.” For more granular analysis by channel or device, use Google Analytics 4. Note that Shopify counts “sessions” (not unique visitors), so the same person visiting twice and buying once counts as 2 sessions and 1 conversion — making your rate appear lower than a unique-visitor calculation would show.
Does Shopify conversion rate include all traffic?
Yes — Shopify’s reported conversion rate includes all online store sessions by default. This means bot traffic, accidental visits, and non-purchasing browsing sessions all dilute the number. For a more accurate picture, filter by channel in Google Analytics and look at conversion rates for your key traffic sources individually.
How often should I check my conversion rate?
Weekly for trend monitoring. Monthly for strategic decisions. Do not react to daily fluctuations — conversion rates naturally vary day-to-day based on traffic mix (weekend traffic converts differently than weekday), marketing campaigns in flight, and inventory changes. Use a 28-day rolling average for the most stable benchmark comparison.
What conversion rate should I aim for?
Aim for the top quartile of your specific industry vertical rather than an absolute number. If you are in fashion at 1.4%, target 2.0% as your first milestone. If you are in food and beverage at 2.0%, target 3.0%+. Use the CRO ROI calculator to see exactly how much additional revenue each 0.5% improvement would generate for your store.
Is a 5% conversion rate realistic on Shopify?
For certain stores, yes — particularly in health and beauty, food and beverage, and subscription-based businesses with strong email lists. For most stores, 5% is aspirational rather than realistic as a sustained average. The top 10% of Shopify stores sit around 4.7%. Some stores hit 5%+ during promotional periods (Black Friday, major sales events) but sustain a lower baseline rate year-round.
Does improving site speed actually increase conversion?
Consistently, yes. Research from Google and Shopify’s own data shows that every 100ms improvement in load time correlates with approximately a 1.1% increase in conversion for mobile shoppers. A store that reduces its LCP from 5 seconds to 2.5 seconds can realistically see a 10–20% improvement in mobile conversion rate. Here is how to speed up your Shopify store step by step.
Stop Benchmarking — Start Improving
Benchmarks are a compass, not the destination. They tell you whether you are on track and where to focus — but the actual revenue comes from doing the work.
If you are below average: fix the fundamentals. Speed, mobile experience, trust signals, and checkout flow. These are not optional — they are prerequisites.
If you are at average: start testing. You have enough traffic and enough baseline conversion to see real results from systematic CRO. Every 0.5% lift at your traffic level translates to real money — use the CRO ROI calculator to see the exact number.
If you are above average: protect what you have built, increase AOV, and shift focus to retention and lifetime value. The biggest risk is complacency.
Wherever you land, the data is clear: Shopify stores that invest in conversion optimization outperform those that chase traffic alone. More visitors to a broken funnel is just more waste. A better funnel converts the traffic you already have.
Book a free CRO audit and we will benchmark your store against the specific verticals that matter for your business — then show you exactly where the biggest revenue gaps are hiding.